Server and Application Reliability by the Numbers: Understanding “The Nines”
Reliability/Uptime by the Numbers
Organizations measure server and application reliability percentages in “nines.” There is an order of magnitude difference of server and application reliability and uptime between each additional “nine.” Four nines – 99.99% – reliability equals 52.56 minutes of unplanned per server/per annum downtime or 4.32 minutes of per server monthly unplanned downtime (See Table 1). By contrast, five nines – 99.999% – is the equivalent of 5.26 minutes of unplanned per server/per annum and just 25.9 seconds of monthly unplanned system downtime. The highly sought after continuous uptime and availability levels of six nines equals a near-imperceptible 2.59 seconds of per server unplanned monthly downtime, while seven nines equals 3.15 seconds of yearly system downtime.
Table1 below depicts the availability percentages and the equivalent number of annual, monthly and weekly hours and minutes of per server/per annum downtime. It illustrates the business and monetary impact on operations. ITIC publishes this table in every one of its Global Server Hardware, Server OS Reliability reports. It serves as a useful reference guide to enable organizations to calculate downtime and determine their levels of server uptime.
Table 1: Reliability/Uptime by the Numbers
| Reliability % | Downtime per year | Downtime per month | Downtime per week |
| 90% (one nine) | 36.5 days | 72 hours | 16.8 hours |
| 95% | 18.25 days | 36 hours | 8.4 hours |
| 97% | 10.96 days | 21.6 hours | 5.04 hours |
| 98% | 7.30 days | 14.4 hours | 3.36 hours |
| 99% (two nines) | 3.65 days | 7.20 hours | 1.68 hours |
| 99.5% | 1.83 days | 3.60 hours | 50.4 minutes |
| 99.8% | 17.52 hours | 86.23 minutes | 20.16 minutes |
| 99.9% (three nines) | 8.76 hours | 43.8 minutes | 10.1 minutes |
| 99.95% | 4.38 hours | 21.56 minutes | 5.04 minutes |
| 99.99% (four nines) | 52.56 minutes | 4.32 minutes | 1.01 minutes |
| 99.999% (five nines) | 5.26 minutes | 25.9 seconds | 6.05 seconds |
| 99.9999% (six nines) | 31.5 seconds | 2.59 seconds | 0.605 seconds |
| 99.99999% (seven nines) | 3.15 seconds | 0.259 seconds | 0.0605 seconds |
Source: ITIC 2022 Global Server Hardware, Server OS Reliability Survey
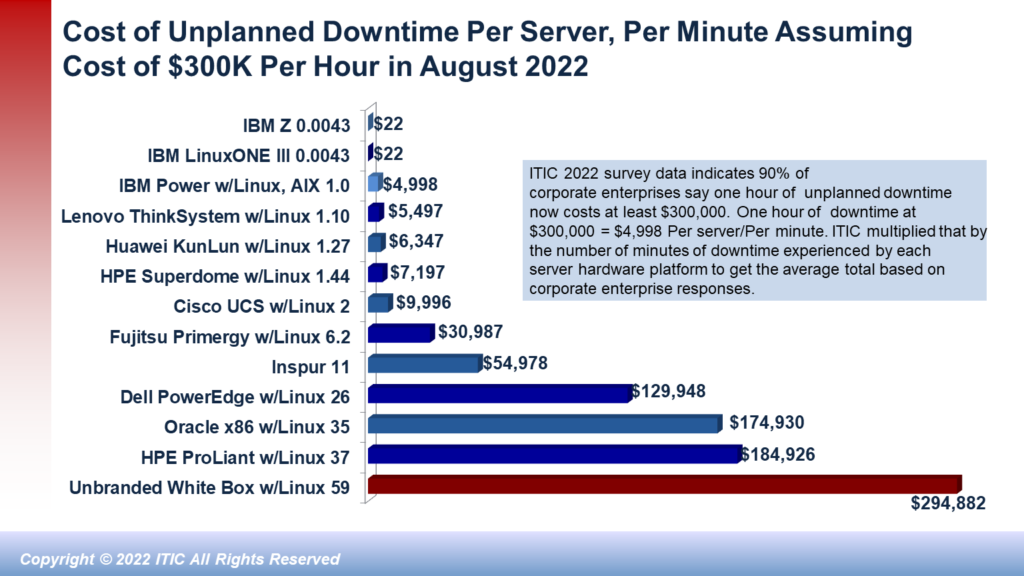
The aforementioned metrics clearly underscore that the IBM z14, z15 and the newest z16; along with the LinuxONE III platform continue to maintain continuous levels of reliability, with just 0.0043 minutes of unplanned monthly per server downtime. This equates to just 3.15 seconds of unplanned per server annual downtime which is the equivalent of “seven nines” of true fault tolerant uptime. They were followed closely by the IBM Power8, Power9 and Power10 with one (1) minute of per server unplanned monthly downtime and the Lenovo x86-based ThinkSystem with 1.10 minutes of per server unplanned downtime each month. In practical terms, this means there is minimal or imperceptible impact on daily business operations, end user productivity and corporate revenue.
In 2022 and heading into 2023, a price tag of $100,000 (USD) for one hour of downtime for a single server is extremely conservative for all but the smallest micro SMBs with one to 25 employees. It equates to $1,670 per minute/per server. Hourly cost of downtime calculated at $300,000 equals about $5,000 per server/per minute. The cost of a more severe or protracted hourly outage that a business estimated at $1 million (USD) is the equivalent of $16,700 per server/per minute.
ITIC’s 2022 Global Server Hardware and Server OS Reliability Survey found that 91% of respondents now estimate that one hour of downtime costs the firm $301,000 or more; this is an increase of two (2) percentage points in less than two year. Of that number, 44% of those polled indicated that hourly downtime costs now exceed $1 million. Since 2021, only one (1%) percent of respondents said a single hour of downtime costs them $100,000 or less. Nine percent (9%) of respondents valued hourly downtime at $101,000 to $300,000.
There are many cost variables. For instance, an issue that takes down a server(s) running a non-business essential application; or downtime that occurs in off-peak or non-usage hours, may have minimal to no impact on business operations and negligible financial consequences.
On the other end of the spectrum, cloud-based server outages involving a virtualized server running two, three or four instances of a business-critical application housed in a single physical machine have the potential to double, triple or quadruple business losses when daily business operations are interrupted and employees and business partners, suppliers and other stakeholders are denied access to critical data.
The most expensive hourly downtime scenario presented in Table 2 depicts per server/per minute outage expense impacting 1,000 servers at an organization that values an hour of downtime at $10 million. In this example, a large enterprise could conceivably sustain crippling losses of $166,667,000 per server/per minute.
The aforementioned ITIC Hourly Downtime monetary figures represent only the costs associated with remediating the actual technical issues and business problems that caused the server or OS to fail. They do not include legal fees, criminal or civil penalties the company may incur or any “goodwill gestures” that the firm may elect to pay customers (e.g., discounted or free equipment or services).
Server and Application Reliability by the Numbers: Understanding “The Nines” Read More »

